MAGNETICS for NX can calculate losses using different approaches e.g. eddy losses or losses based on the Generalized Steinmetz Equation.
Initial Situation
Siemens Servo Motor 1FT6
This universal synchronous motor is used for many high-performance motion control applications. It uses permanent-magnets, has very small torque ripple and an almost constant torque characteristic.

The motor we analyzed uses 36 nuts, 8 permanentmagnets, 4 poles.
MAGNETICS for NX can calculate losses using different approaches. In this case we will calculate for Eddy Losses. These are given by the formula R*I^2. An other approach for losses calculation is to use the Generalized Steinmetz Equation (GSE).
Appropriate Method
2D Magnetodynamic Analysis, Testcases
In this analysis our goal is to analyze for eddy losses over the rotor angle. This can be done quite easy in 2D using the magnetodynamic timedomain solutiontype. The analysis in 3D would also be possible.
To analyze for joule losses we have to set the rotor to a rotation velocity and calculate for the eddy currents in the conducting areas. In this case the main conducting area are the permanent magnets.
To check for plausibility we want to analyze the motor in 3 cases:
1. Rotating rotor, rotating current-field:
- We expect small losses.
2. Rotating rotor, fixed current-field:
- We expect higher losses.
3. Fixed rotor, rotating current-field:
- Again we expect higher losses.
Result
Eddy Losses
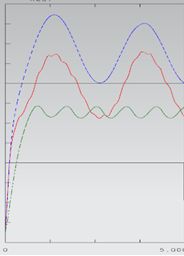
The picture shows the resulting joule losses, that were computed on the conducting areas of the 1FT6 Servo Motor. The three curves show the expected behaviour of the testcases:

- Green curve, first case:
The smallest losses are found when both the rotor and the current-field are rotating. This is the common situation while the motor is running. - Red curve, second case:
This curve shows the expected higher losses. - Blue curve, third case:
This curve also shows the expected higher losses.


