Lightning strikes that occur in wind turbine towers can be analyzed to help for dimensioning of arrestors and to estimate the electric and magnetic field strengths that appear.
This example shows how this kind of analysis can be done in Magnetics for NX/Simcenter. The tower is made of steel bars that conduct the lightning current down into the ground. Inside is a cable with an resistor in which we want to analyze the specific energy.
Download as PDF Download NX Files
Initial Situation
Concrete Tower, Bars Enforced
The problem is a 140 m high conical (Ø9 m to Ø5 m) wind turbine concrete tower. There are 50 vertical Ø12 mm steel bars distributed around the circumference and the bars are all electrical connected at top and bottom to a steel plate, as in a bird cage. Inside this tower an Ø5 mm cable is connected to the top steel plate and going down to the bottom, were a 100V arrestor (SPD) is place between cable wire and the lower steel plate.
Picture: lightning Strikes at Industrial wind turbines (source: analysis.windenergyupdate.com)
When lightning current is conducted down along the bars, the transfer impedance induced voltage over the SPD will easily be so high, that the SPD conducts. For to choose this SPD, we need to know the peak current and the specific energy of the current, which is: W = ∫t2dt [Joule/Ω]. The lightning current is a double exponential time function, ip=200 kA, τr = 1μs and τf = 500 μs. The lightning channel is 1 km high and vertical. For to determine the LPZ we also need to know the B field, as function of time, inside the tower at different positions.
Some given dimensions are these:
- 50 steel bars with diameter 12 mm,
- Height is 140 m,
- Lightning channel is 350 m,
- Diameter: bottom 9, top 5 m.
Appropriate Method
3D Full Wave Transient with Circuits
This kind of problem is solved in NX Magnetics using a Full Wave 3D solution type, the application of 1D line elements and additionally circuits. Some parts will be modeled by 3D elements. Of course the air volume is 3D.
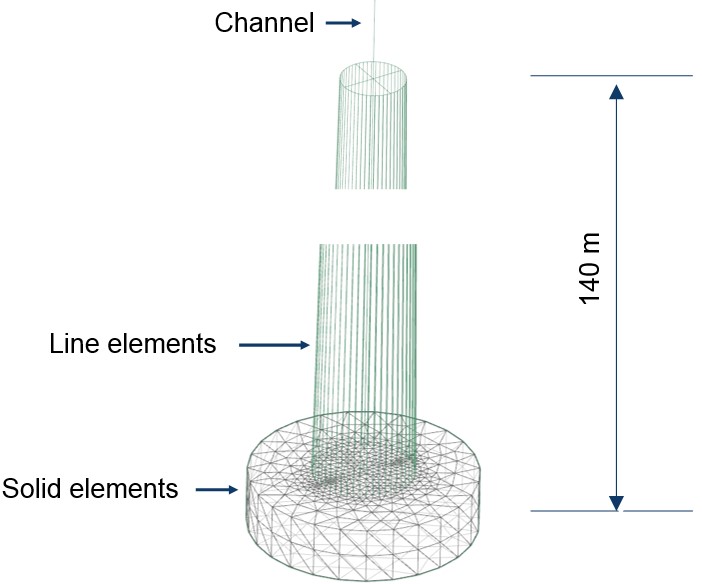 Picture: FEM Model of the Tower. Some Elements are Line, others are 3D. Sheets would also be possible
According to IEC 62305 and [1] the fast rise time and slow decay of typical lightning signals can be modeled as a double exponential time function with a rise at 1 us and a following fall. For the transient simulation we use the following analytical formula:
Current = -2e5*(Exp[$Time/-1e-6]-Exp[$Time/-500e-6]).
With 500 time steps each with 2.e-7 sec the curve of next picture was applied.
 Picture: Input Current. Double Exponential Function. This function is applied to the top of the lightning channel
The SPD is modeled by a 1D resistor circuit element. Strong coupling of circuits to 3D models is possible in NX Magnetics, no external tool is necessary. In this case we used a fixed ohm resistance, but we could make it depend on its voltage, similar to diodes.
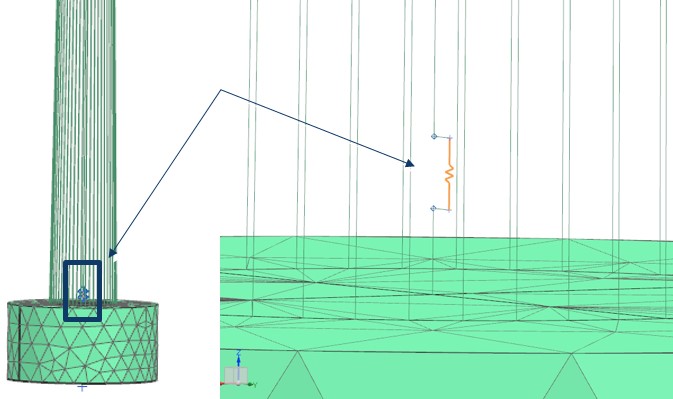 Picture: The SPC is modeled by a 1D Circuit Resistor Element
We use the full wave solution as described in http://www.nxmagnetics.de/index.php/solutions/full-wave-timedomain. The Full Wave Solver takes into account all terms of Maxwell's equations. Due to this the wavelength can be smaller than the analyzed part dimensions and even very high frequencies are allowed. In the time domain results are the electric and magnetic field for every time step. The Electric field equation can be solved in the time- or frequency domain.
[1]: Heidler, Zischank, Flisowski, Bouquegneau, Mazzetti: “Parameters of Lightning Current given in IEC 62305 – Background, Experience and Outlook”. 29th International Conference on Lightning Protection 23rd-26th June 2008 – Uppsala, Sweden.
Result
B Field and SPC Current
The field solution allows detailed insight in the behavior of the magnetic, electric and the current fields. All results can be plotted and animated over time. The next two pictures show how the magnetic field establishes in the beginning phase of lightning.
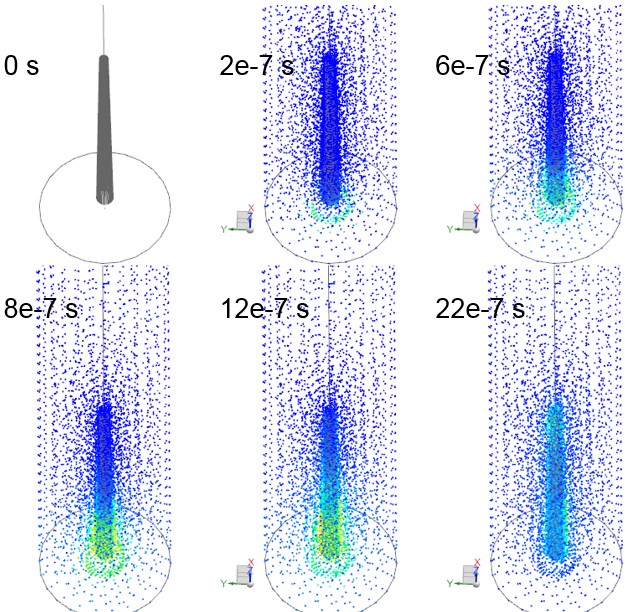 Picture: B Field at some time steps at beginning
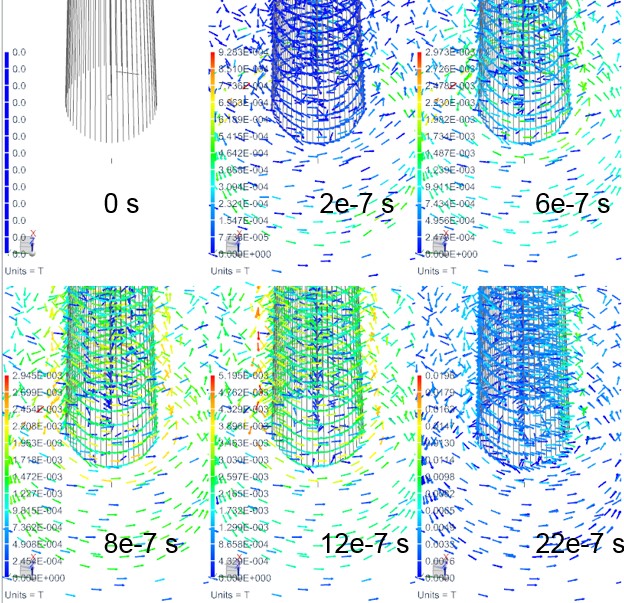 Picture: B Field Detail view
Of course you may want to know how the field behaves at a certain distance from the tower. The following picture shows the point location and the resulting graph.
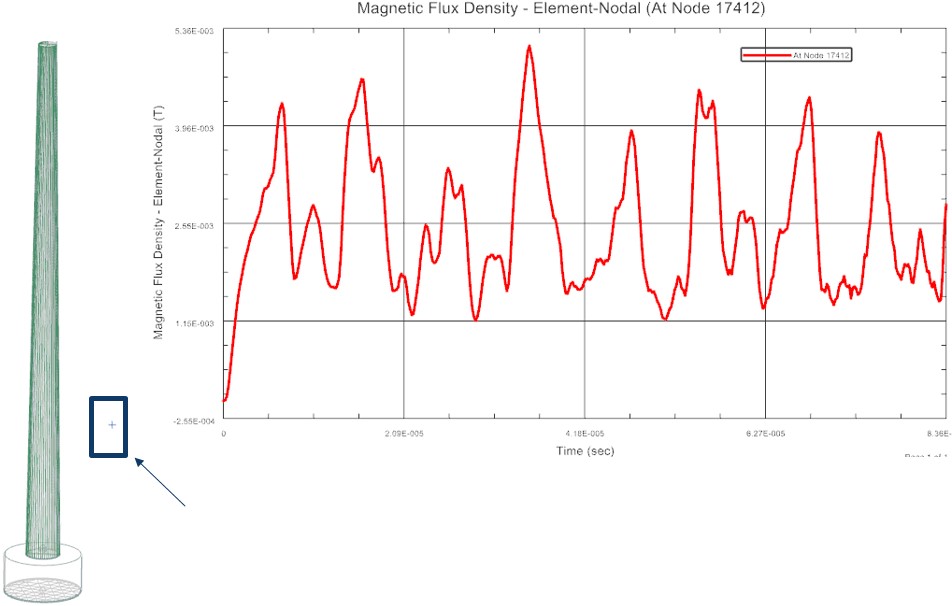 Picture: B over Time at given Point
Additionally to the field results there are all currents and voltages available at electrodes. The following picture shows in blue the applied current curve and in red the reaction voltage. The voltage shows oscillations that result from electromagnetic wave effects. Only a high frequency solution is capable to find out this effect.
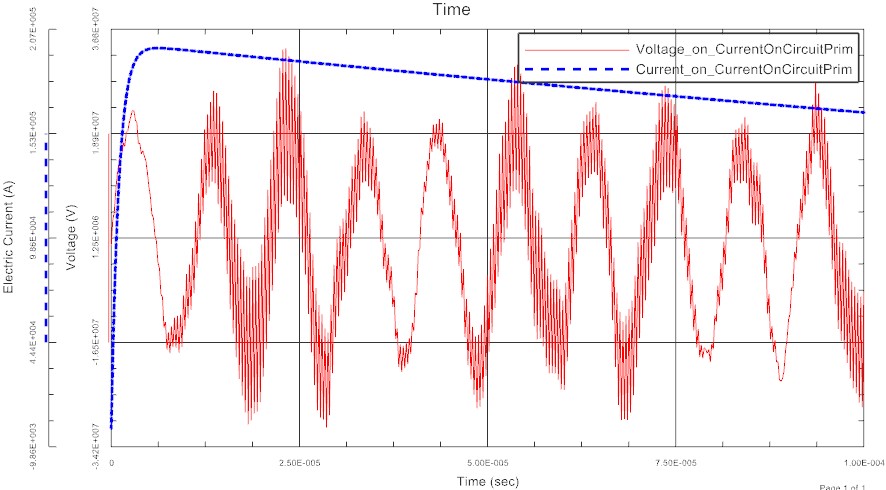 Picture: Current/Voltage of Lightning Load
The requested peak current can be found from the following graph.
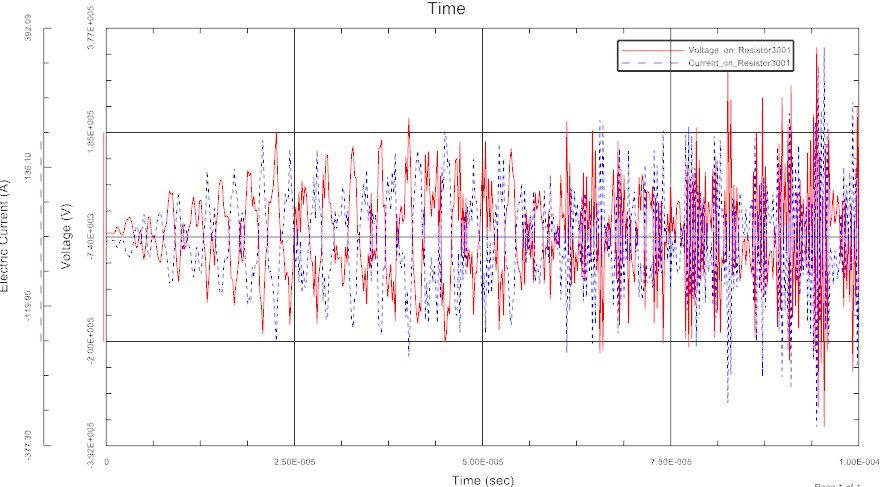 Picture: Current/Voltage at SPD (1000 Ohm)
The next graph is SPC Current^2 integrated in time. Integration of Results is done with NX Function tools for graphs.
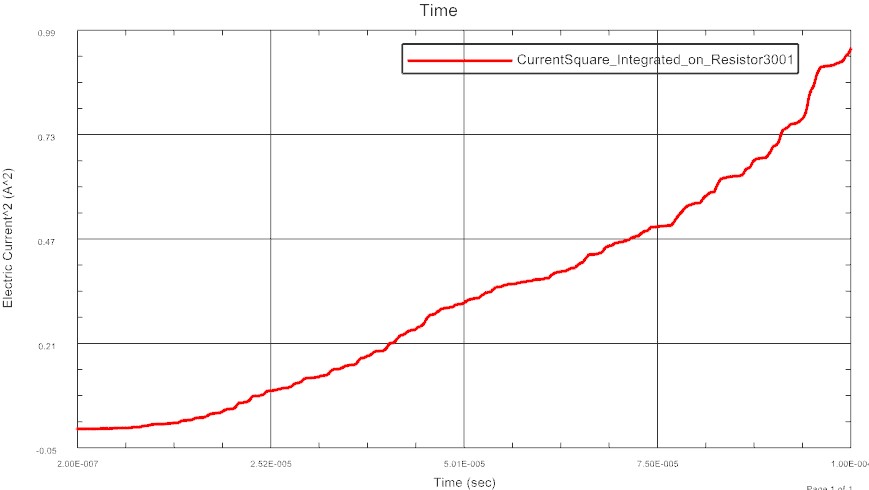 Picture: Specific Energy of Current at SPD
Performance, Statistics:
- Total number of elements: 60782
- Total number of nodes: 8962
- Number of Line elements: 2944
- Number of Tetra elements: 48301
- Solution time: 40 min. (500 Time Steps)
- CPU: 2162 s.
- Memory used: 680 Mb
- Computer: Intel Pentium i7, 4 cores


