This example deals with a three phase medium power transformer. Goal is to find the main characteristics e.g. power and efficiency under normal operating conditions.
Initial Situation
Find Transformer Characteristics
This example deals with a three phase medium power transformer. Goal is to find the main characteristics e.g. power and efficiency under normal operating conditions through FEM simulation. Also of interest is the shielding effect of the housing. In further simulations one could also simulate for power up behavior and electric short circuit conditions. Also acoustics and thermal conditions may be of interest and can be simulated.
The following picture shows definitions of the phase currents
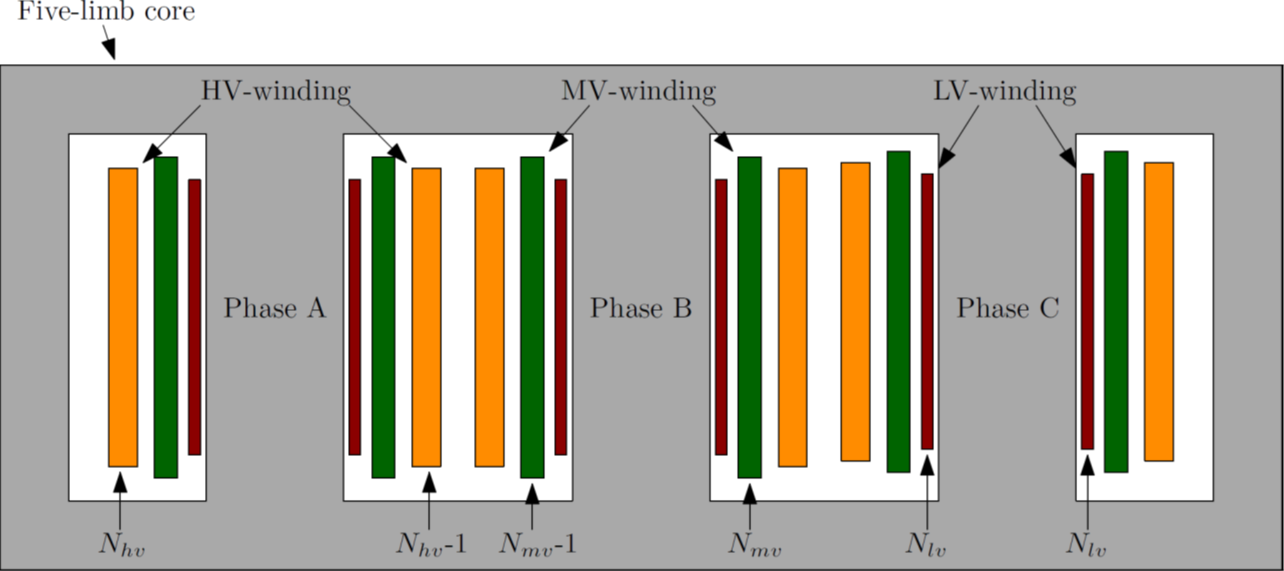 Picture: Scheme of Transformer
- Three Coils: High Voltage (active), Medium Voltage (active) and Low Voltage (passive).
- Three Phases: Phase A, Phase B and Phase C.
- Magnetic Core: With non-linear Material.
The CAD model for this transformer is set up as a half model that is sufficient for doing FEM simulations.
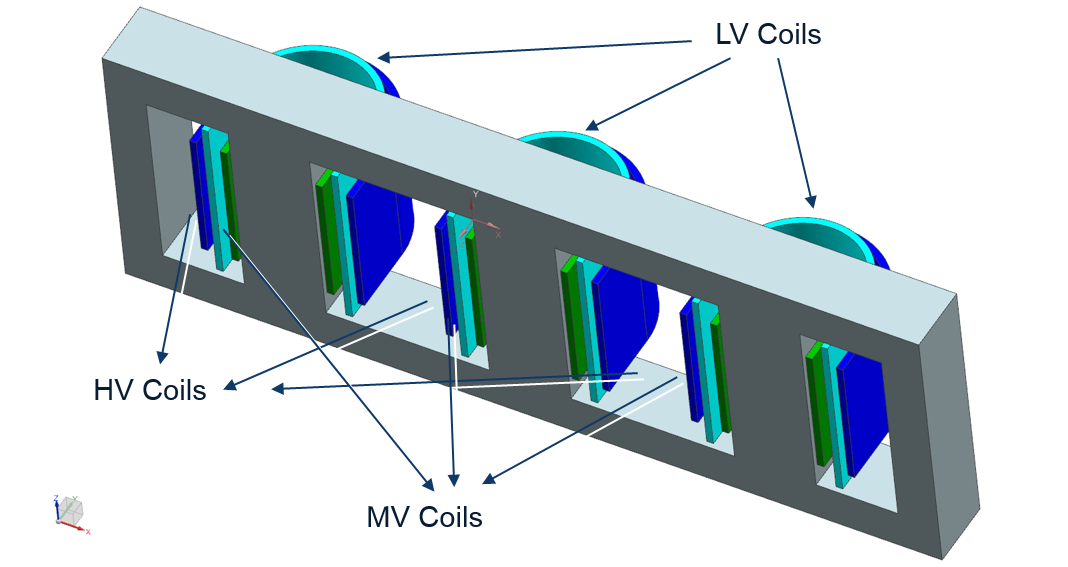 Picture: CAD Model of Transformer
Main characteristics for this task are these:
- Dimensions: Transformer 200 mm x 600 mm; and Housing 300 mm x 800 mm,
- Coils: Stranded Coils with 230 (HV blue), 115 (MV cyan) and 55 (LV green) Windings,
- Shielding: Nu-Metal Shielding (red) with a thickness of 5mm,
- Surrounding Air: Sufficiently large Volume with surrounding Air (transparent blue).
Appropriate Method
3D FEM Model with Circuit
To set up a 3D simulation the half CAD model is meshed with either hexahedral or tetrahedral elements or mixtures of these. We use mostly hexahedral elements because of the quite simple CAD shape of the core and also the coils. The following picture shows this mesh.
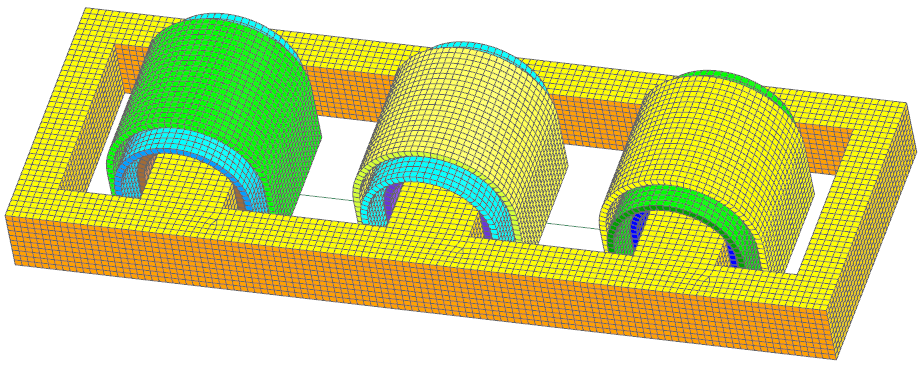 Picture: FEM Model of Transformer
In a next step a housing is modeled also in CAD and meshed in the FEM environment of Simcenter. The material type mu-metal for best shielding effects (red) with a thickness of 5mm is applied.
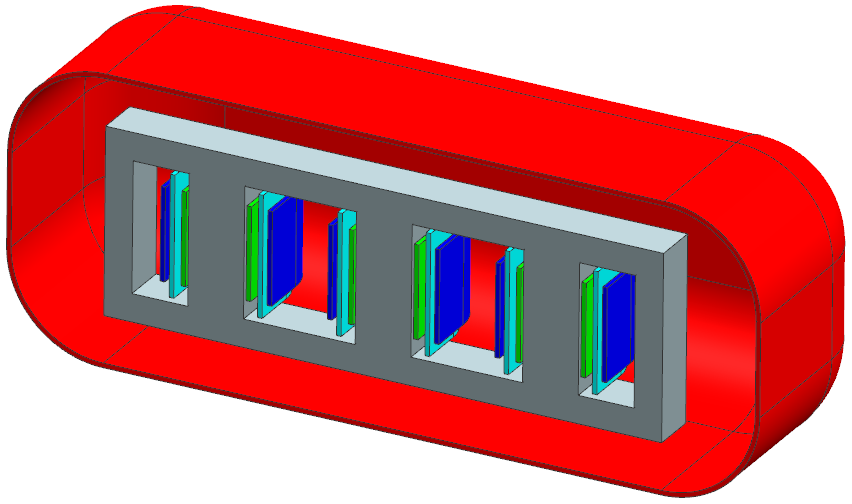 Picture: Housing of Transformer (red)
The surrounding air is modeled as a sufficient large sphere volume (transparent blue in next picture).
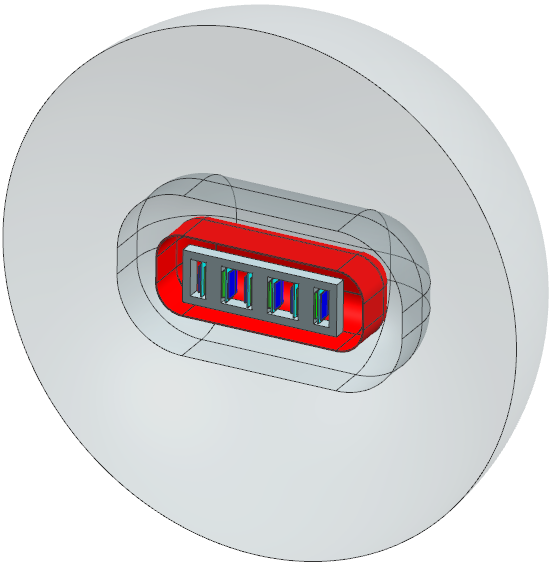
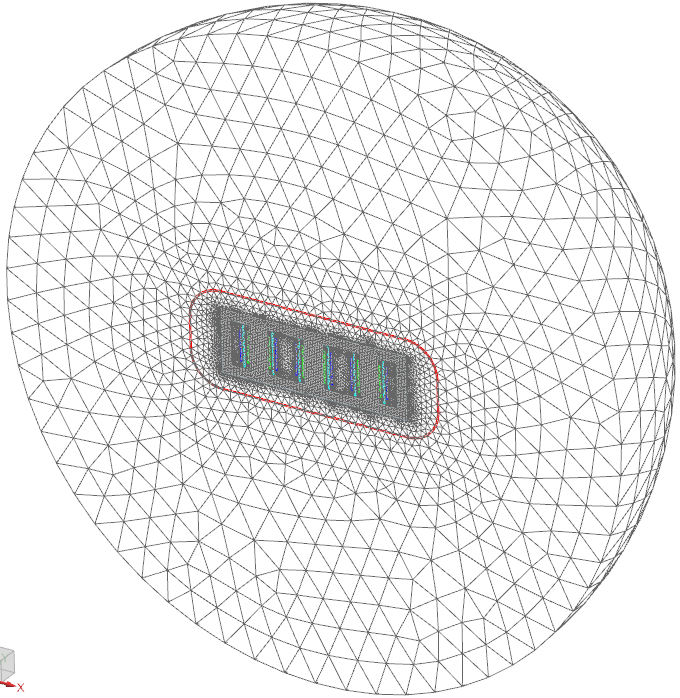
Picture: Surrounding air (transparent blue) and corresponding air mesh
Finally a circuit network is defined to connect the coils in the desired way. Corresponding to the following two pictures different types of connections or cables are used:
On the primary side of the transformer we use these:
- Cable Networks: Cable connectors network between HV (blue) and MV (cyan) coils
- Cross Connectors: Switchable resistance between respective HV and MV coils (for short circuit simulation only)
- Current Cable: Connectors for imposing the respective currents IA, IB and IC.
 Picture: Circuit network on the primary side
On the secondary side of the transformer we use these:
- Cable Networks: Cable connectors network between LV (coils)
- Resistive Cable: Resistive RL cable connectors between LV coils and Mass
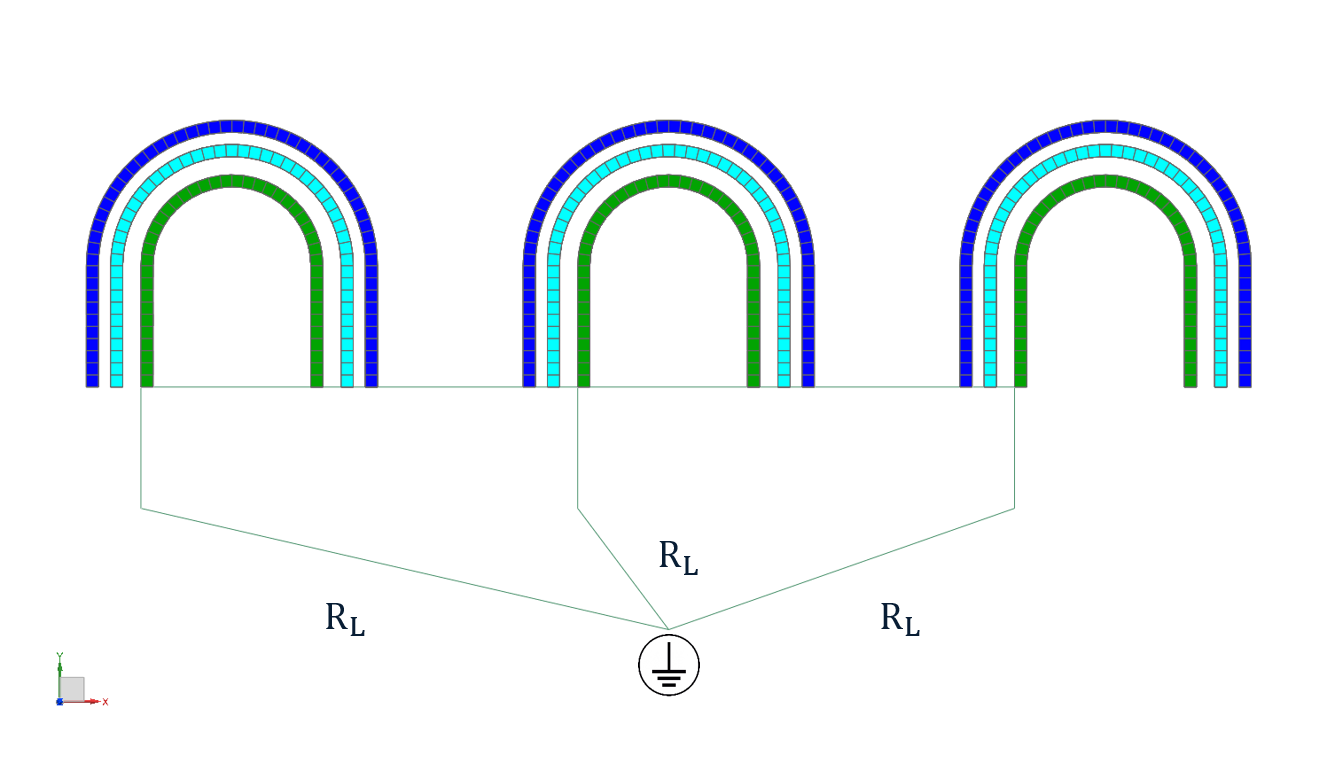 Picture: Circuit network on the secondary side
Result
Power Up, Normal Operation, Short Circuit
The setup of the solution is as follows:
Phase 1: Normal operation
- HV and MV coils are still connected via a low resistance cables.
- HV and MV coils are driven by a constant driving current.
- LV coils are connected via high resistance cable connectors.
This general procedure is the same for the transient and frequency simulations.
Following the results of power and efficiency for normal transformer operation are shown.
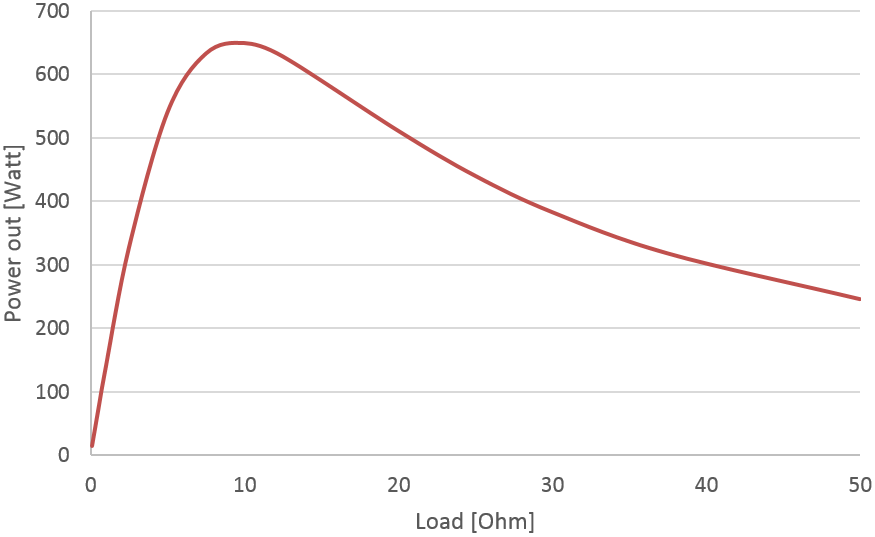 Picture: Power Result
- Increasing Power: Between 0 and 8 Ohms
- Maximum Power: Peak appears at (roughly) 8-10 Ohms
- Stagnation: At higher loads >35 Ohms
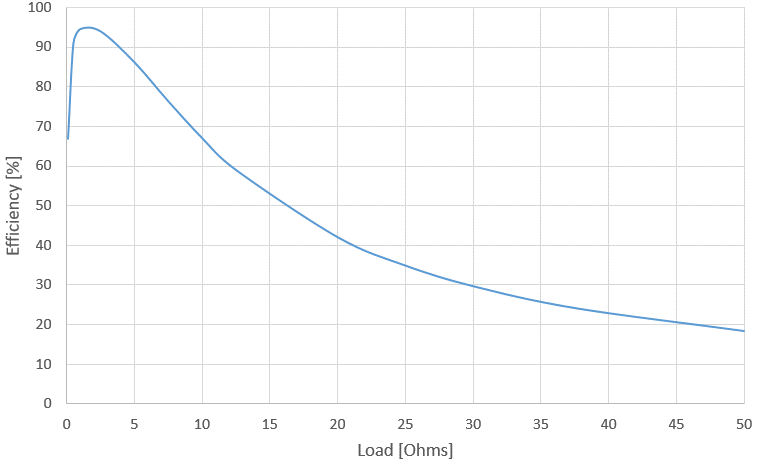 Picture: Efficiency Result
- Maximum Efficiency: Peak appears at (roughly) 1-3 Ohms
- Decreasing Efficiency: At higher loads >3 Ohms
A result of the magnetic flux density over time in the core can be seen in the following picture.
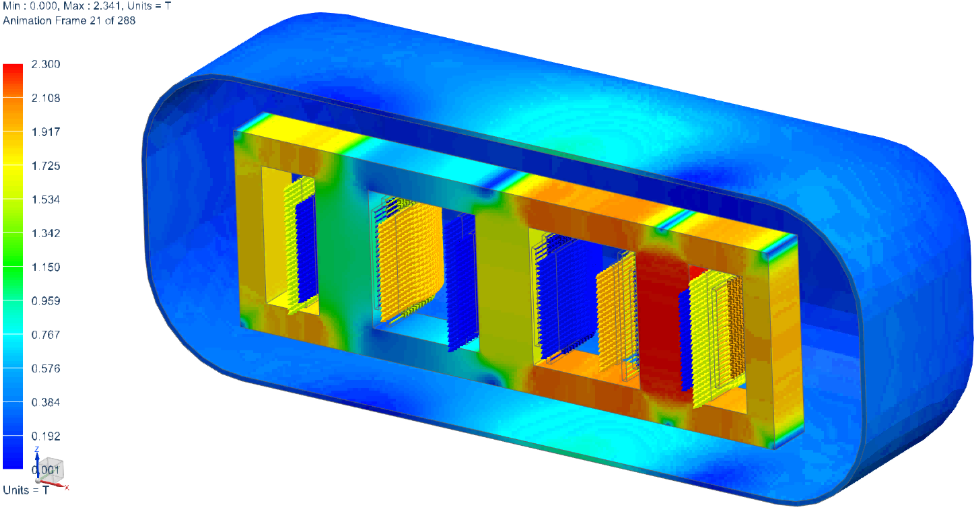 Picture: Magnetic Flux Density and Coil Current
Following to phase 1 there can be solutions for two additional simulations which are not shown here.
Phase 2: Power up (results not shown here)
- HV and MV coils are connected via a low resistance cables.
- HV and MV coils are driven by a non-constant driving current.
- Until a first time T1 the driving Current is increased to simulate the powering up.
- LV coils are connected via high resistance cable connectors.
Phase 3: Short Circuit (results not shown here)
- HV and MV coils are still connected via a low resistance cables.
- HV and MV coils are driven by a constant driving current.
- After a second time T2 the high resistance cable connector connecting the LV coils are rapidly decreased to simulate a short circuit.
Conclusion: It has been shown that using these methods in NX Magnetics it is simply possible to analyze transformers, find power and efficiency. In further simulation types there can be checked for temperatures, structural stresses and acoustics.


